CGAT User Manual
Ikuo Uchiyama
Copyright © 2006 by Ikuo Uchiyama
What is CGAT ?
CGAT is a Comparative Genome Analysis Tool that was developed for detailed comparison of closely related bacterial-sized genomes, mainly for analysis of complex evolutionary changes between two related genomes. CGAT visualizes precomputed pairwise genome alignments on both dotplot and alignment viewers. Users can put several information on this alignment, such as existence of tandem repeats or interspersed repetitive sequences and changes in codon usage bias, to facilitate interpretation of the observed genomic changes. Besides visualization functionalities, CGAT also provides a general framework to process genome-scale alignments using various existent alignment programs such as BLAST/MegaBlast, FASTA, MUMmer, Blat and BlastZ.
Basically, CGAT employs a client-server architecture, which consists of AlignmentViewer (client; a Java application) and DataServer (a set of Perl scripts). The DataServer consists of data construction scripts and CGI scripts and AlignmentViewer obtains the data from the server thorough the HTTP protocol. AlignmentViewer can also obtain data from the local file system when the server and client are installed on the same machine.
Installing CGAT
Requirements
AlignmentViewer is written in Java and should run on any machine supporting Java (JDK 1.4 or higher).
DataServer is a set of Perl scripts and assumes Unix environment with Perl installed (version 5.8 or higher). It also assumes that the perl executable is installed in the /usr/bin directory; please make a symbolic link if it is located in a different directory. The LWP (libwww-perl) module, which is downloadable from the CPAN site, is also required when you want to download data from the MBGD server. DataServer also needs an HTTPD server for communicating with the client program. In this manual, we assume that Apache HTTPD version 2.0 or more is installed on your server machine.
CGAT uses several programs for calculating alignments of two sequences and identifying several feature segments on individual sequences. Currently the following programs are supported:
Table 1. Alignment programs currently supported by CGAT
| program | URL |
|---|---|
| Blast/MegaBlast | http://www.ncbi.nlm.nih.gov/BLAST/ |
| Fasta | http://fasta.bioch.virginia.edu/ |
| MUMmer | http://mummer.sourceforge.net/ |
| Blat/WABA | http://www.cse.ucsc.edu/~kent |
| BlastZ | http://www.bx.psu.edu/miller_lab/ |
| PatternHunter | http://www.bioinformaticssolutions.com/products/ph/ |
| CHAOS | http://lagan.stanford.edu/lagan_web/index.shtml |
| GAME | http://cancer.informatics.indiana.edu/game/ |
| SSAHA | http://www.sanger.ac.uk/Software/analysis/SSAHA/ |
You should install one or more of the above programs on the server machine before installing the CGAT DataServer. Please refer to the above URL for installing individual programs. Basically, the DataServer assumes at least the NCBI Blast/MegaBlast package is installed.
Download
The latest version of CGAT is available at http://mbgd.genome.ad.jp/CGAT/. You can download and install only the client program (AlignmentViewer.jar) or the full version including both the client and server programs (CGAT.tar) depending on what you need.
The client program ( AlignmentViewer.jar). You can download and install only the client program if you intend to connect to the existing servers that you have already set up or to the default server (http://mbgd.genome.ad.jp/CGAT/) for trial.
The client program as a Mac OSX application ( AlignmentViewer.app). We recommend Mac OSX users to download this because it has been set up with increased memory allocation that solves the problem described in the next section.
The full version of CGAT ( CGAT.tgz), including both the client and server programs. You must install this package if you intend to analyze your own data locally.
Install
AlignmentViewer
Basically, you need not particular operation after having downloaded the program file (AlignmentViewer.jar) — double click the icon (OSX or Windows) or type the java command (Unix) to invoke the program. See the chapter " The CGAT AlignmentViewer program "
However, in the default setting of the Java virtual machine (JVM), you will be likely to encounter a memory allocation error especially when aligning long sequences dynamically. To avoid this problem, you need to increase the size of the memory allocation pool for the JVM.
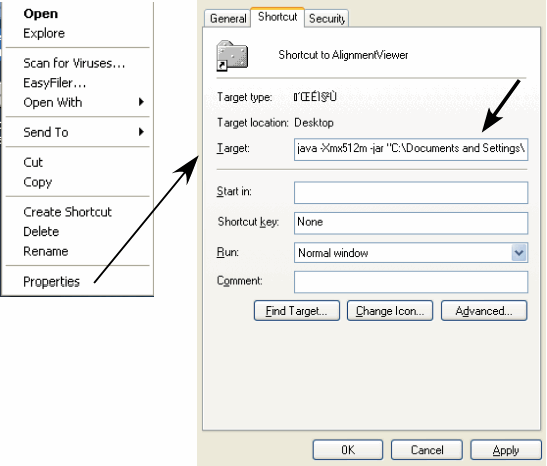
Windows: Download the AlignmentViewer.jar file and do the following (see Figure 1).
Create a shortcut of the AlignmentViewer.jar file (Right-click on the jar file ⇒ Create Shortcut).
Open the properties window of the shortcut (Right-click on the shortcut ⇒ Properties).
Open the Shortcut tab and enter the java command in the Target: box as follows: [ java -Xmx512m -jar "C:\Documents and Settings\..." ], where "C:\Documents and Settings\..." is the original file location. This might be different in you situation, but do not modify the original name in anyway. Then, press "OK".
Mac OSX: Download and use the OSX application version of AlignmentViewer (AlignmentViewer.app), instead of the AlignmentViewer.jar file.
Linux/Unix: Download the AlignmentViewer.jar file and type java -Xmx512m -jar AlignmentViewer.jar to invoke the program.
DataServer
Copy the downloaded archive CGAT.tgz into an appropriate directory and extract files by tar command, which generates a directory named CGAT. Enter this directory and invoke a configuration script SetUp.pl.
tar cvfz CGAT.tgz cd CGAT SetUp.pl |
# in csh or tcsh source etc/cgat.csh # in sh or bash . etc/cgat.sh |
The set up script tries to detect alignment programs available on the server machine and installs detected programs in the $CGAT_HOME/build/align directory. You might want to move some commands from the $CGAT_HOME/build/align.in directory or to remove some unnecessary commands manually.
Similarly, you might want to install manually some optional commands for collecting feature segments from the $CGAT_HOME/build/segment.opt directory. Note that in this case you must always set up by yourself (if you wanted), since currently the set up script does not try to check the availability of these commands automatically. Currently, the following commands are available:
Glimmer: Microbial gene-finding system available at http://www.cbcb.umd.edu/software/glimmer/. Currently, ver.2 is assumed by default, but you can use ver.3 if you manually edit the commands/Glimmer.pl file. Before that, of course, you must correctly set up the glimmer program itself.
ISfind: Searching an insertion sequence (IS) database by the BLAST program. The IS database should be a FASTA formatted sequence file with each comment line containing IS family name as ">${ISname} Fam:${familyname}", and the file should be installed as $CGAT_HOME/database/isdb . See the IS Finder database for information about IS families. One can use the GIB-IS database available at DDBJ as a downloadable IS database. Download the table file (IS-table-text.txt) and run the following command:
$CGAT_HOME/build/bin/conv_GIB_IS.pl -nr IS-table-text.txt > $CGAT_HOME/database/isdb
The CGAT AlignmentViewer program
Starting AlignmentViewer
On Windows or Mac OSX, double clicking on the "AlignmentViewer" icon invokes the program. On Unix systems, type the following command on the command line:
java -jar AlignmentViewer.jar |
However, when invoking with the above command, you will be likely to encounter a memory allocation error especially when you want to see an alignment of long sequences generated by dynamical calculation. To avoid this, we recommend you to increase the size of the memory allocation pool for the Java virtual machine with the -Xmx option.
java -Xmx512m -jar AlignmentViewer.jar |
Load data
After running the program, first you must load data by choosing File ⇒ Load from the menu.
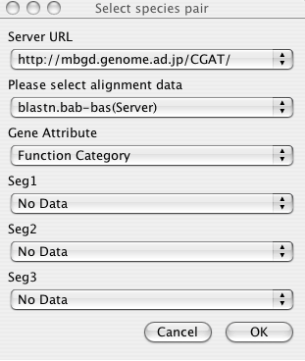
- Server URL
Choose the server from which data are downloaded. By default, only the default CGAT server (running on the MBGD server) is registered. You can add more servers to this list in the Locations section of the Properties panel (File ⇒ Properties), if you or your colleagues have been setup an original new server. See the chapter " The CGAT DataServer package " for server setup and the " Configuring AlignmentViewer "section for properties setup.
- Alignment Data
Choose the alignment data to be downloaded specified by the combination of organism names and a program name. Note that choosing the server URL above reset the list of available alignment data. If you have setup the data on the local file system that the AlignmentViewer program can directly accessed, and have correctly set the CGAT_HOME variable in the Properties panel, you can also choose the data available on the local machine. These data are listed without the "(Server)" indication.
- Gene Attribute
Choose the gene attribute data for coloring genes.
- Feature Segment Data
Choose the feature segment data to be shown on the additional annotation tracks (see the section "Alignment display panel "). By default, maximally three types of segment data can be loaded at once, but the maximum number can be increased in the Properties panel.
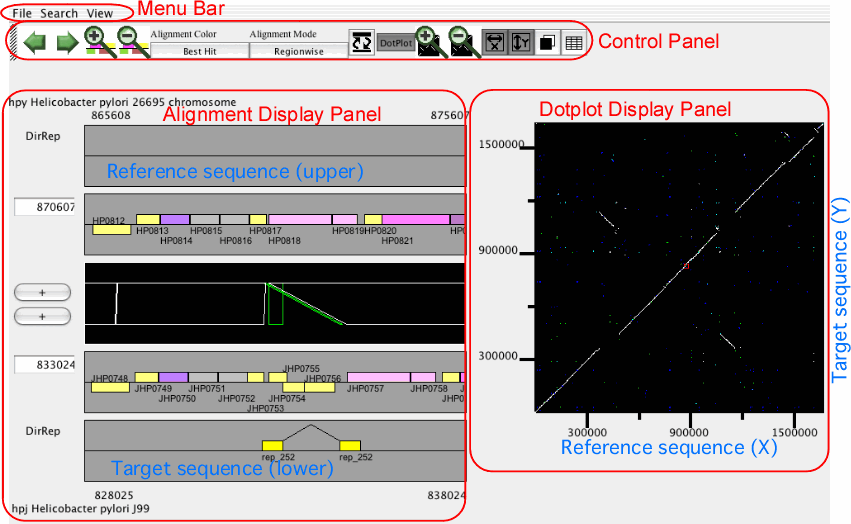
The main window of AlignmentViewer
The main window of AlignmentViewer consists of four parts: a menu bar, a control panel, an alignment display panel, and a dotplot display panel. Both the alignment and dotplot displays show precomputed alignments. Users can change the current view on each display by pressing a scrolling or zooming button on the control panel. These operations update both the alignment and dotplot displays in a coherent manner.
In AlignmentViewer, one of the compared sequences is considered as the reference sequence and the other is considered as the target sequence. In the alignment display panel, the reference and the target sequences are displayed on the upper and lower tracks, respectively, and in the dotplot display panel, the reference and the target sequences correspond to the x- and y-axes, respectively. These sequences can be exchanged by View ⇒ Exchange Reference Genome.
Control panel
The control panel contains several buttons for controlling the current view of both the alignment and dotplot displays.
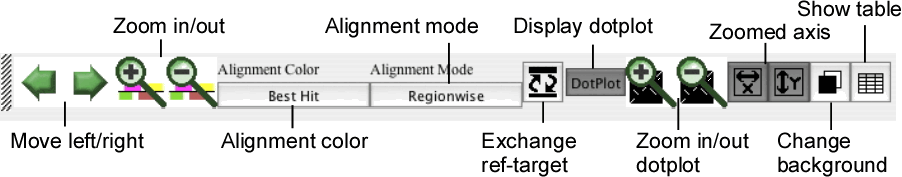
- Move left/right
Move the current position to the left or right along the current alignment.
- Zoom in/out
Zoom-in or -out the current view.
- Alignment color
Toggle the alignment color mode between the "Best Hit" mode and the "Identity" mode.
Best Hit: white, orthologs; cyan, duplicated on the sequence 1; green, duplicated on the sequence 2; and blue, paralogs (by default).
Identity: red, 50%; yellow, 85%; and green, 100% (by default).
- Alignment mode
Toggle the alignment mode between the "Regionwise" alignment mode and the "Reference-target" alignment mode. See the section " Alignment display panel ".
- Exchange ref-target
Exchange the reference sequence and the target sequence.
- Display dotplot
Toggle the status of the dotplot display panel between displayed and hidden.
- Zoom in/out dotplot
Zoom-in or -out the dotplot display.
- Zoomed axis
Specify the axis of the dotplot to be zoomed individually.
- Change background
Toggle the background color of the alignment and dotplot displays between the dark color (black by default) and the light color (white by default).
- Show annotation table
Show an annotation table for information on gene or feature segment.
Alignment display panel
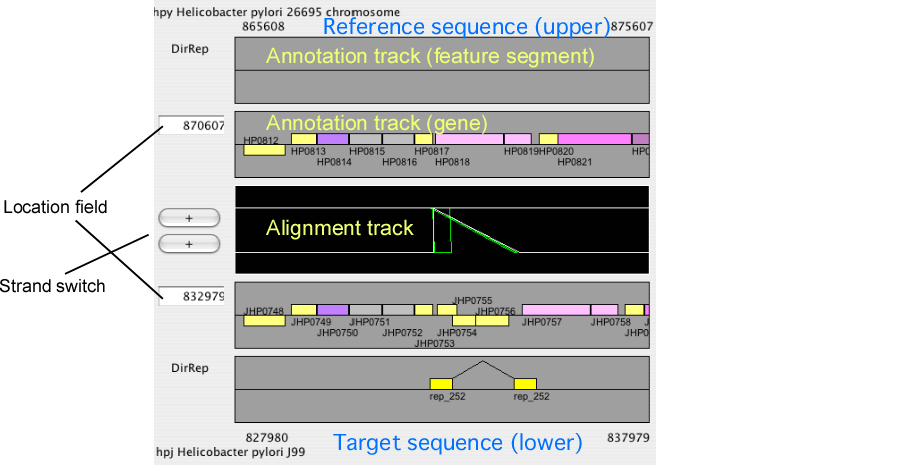
The alignment display panel contains three basic tracks: the central tracks (alignment track) shows a graphical representation of the alignments, and the upper and lower tracks (gene annotation tracks) show the gene annotation of the upper and lower genomes, respectively. More annotation tracks can be added to display the location of several feature segments.
In addition, the "location fields" and the "strand switches" are on the left side of the tracks. The location field indicates the central coordinate of the current view, and strand switch indicates the strand of each genome currently selected. Users can jump to the desired location by entering a coordinate value or a gene identifier (e.g. HP0812) in the location field, and can toggle the strand direction by pressing the strand switch.
Some notes: 1) You must always enter the location of the reference genome if you want to see the orthologous alignment around the specified locus. If you want to specify the location in the current target genome, you should exchanges the reference and the target genomes before entering the position; 2) If you invert the reference genome by the strand switch button, the direction of the subsequent movement is also inverted. This means that when you press the 'move left' button, the cursor in the dotplot display will move right, since the coordinate of the dotplot display is not changed by this operation.
Alignment modes
In CGAT, there are two modes in the alignment display: "regionwise" alignment mode and "reference-target" alignment mode. In the regionwise alignment mode, all alignments included in the current view are displayed. Each alignment is represented as a trapezoid formed by connecting the corresponding endpoints of the aligned region. On the other hand, in the reference-target alignment mode, every orthologous regions of the target sequence is mappend as a fragment onto the reference sequence.
Alignment track
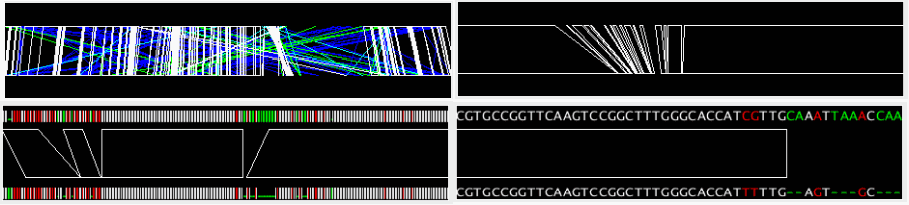
The alignment track displays precomputed alignments schematically. Using the zooming buttons in the control panel, users can change the scale from the entire genome level to the single nucleotide level. In the nucleotide sequence alignment, mismatched site is colored red and gapped site is colored green (by default).
In the regionwise alignment mode, left click on one of the alignment regions (tetragons) sets the center of the selected alignment adjusted to the center of the display.
By right click on the alignment track, a pop-up menu appears including the following items:
View Re-Alignment: Re-calculate alignment between the sequences within the current displayed region. This item appears only when the current displayed region is smaller than the specified length (Size of Realignment). See the "Configuring AlignmentViewer" section.
View Alignment: Display the precomputed alignment under the clicked position.
Ident = ## %: No action. The item is displayed only for showing the percent identity of the precomputed alignment under the clicked position.
Color Legend: Display the color legend for the current alignment display.
Annotation track
The annotation track displays several types of feature segments identified in each genome.
By left click on one of the feature segments in the annotation track, a pop-up menu appears:
SegmentName: Open the web browser to access the web site, if an appropriate URL is defined on the server. Otherwise, no action is taken.
View Sequence: ## - ##: Show the nucleotide sequence of the feature segment.
Clicked Pos: ## : No action. The item is displayed only for showing the clicked position.
Redraw (Set Center=##) : Move the clicked position to the center of the display window.
Search Alignment ## - ## : Search the set of precomputed alignments for those covering the region around the clicked position.
Color Legend: Display the color legend for the current annotation display.
Dotplot display panel
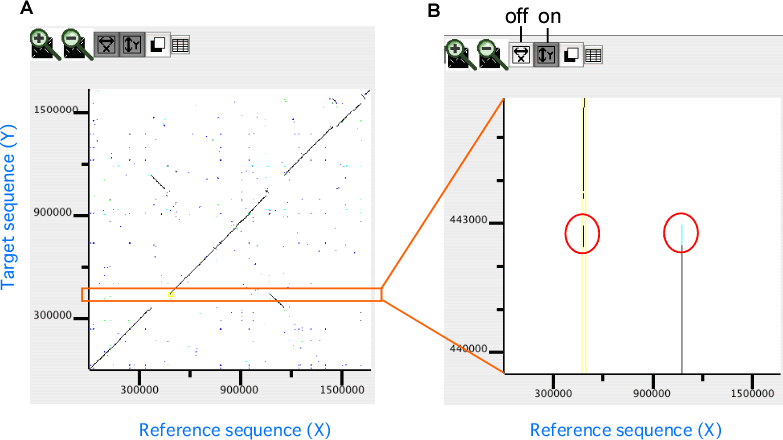
In the dotplot display panel, all alignments are plotted onto the 2-dimensional space with the horizontal (X) and the vertical (Y) axes representing the reference and the target sequences, respectively. In this plot, the current scope, i.e. the region displayed in the alignment display, is also shown as a rectangular region. Users can move the current scope by clicking on any points in the plot to move.
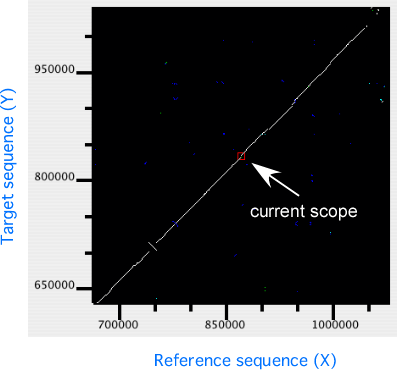
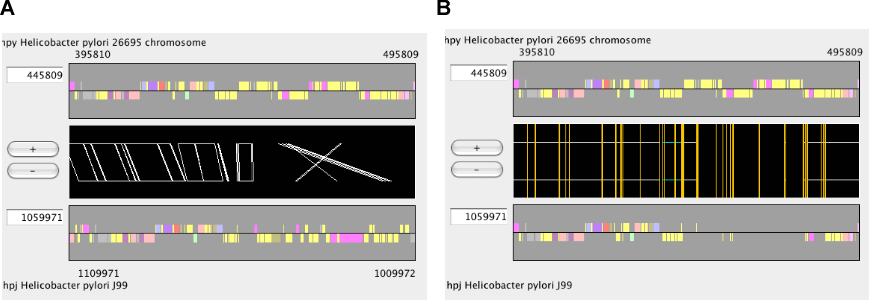
In the dotplot display, independent scaling of the x-axis and y-axis is possible. This feature is useful in visualizing the distribution of homologous regions of a specific segment on one genome against the entirety of the other genome. In the following example, dotplot with expanded y-axis scale clarifies the presence of inverted duplication at both ends of the rearranged segment on the reference genome (x-axis).
Menu items
File menu
Load
Load data from the specified server or the local file system. See the "Starting AlignmentViewer " section.
Search menu
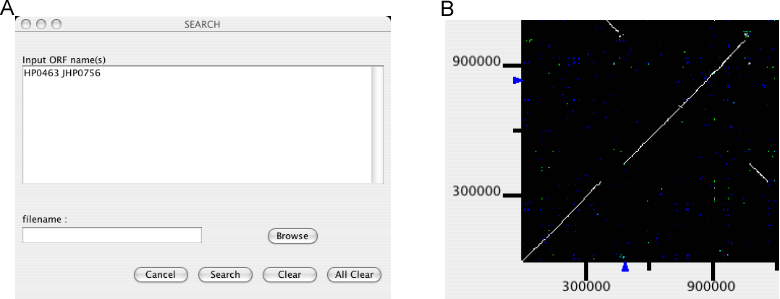
Mark genes
Mark a specified set of genes.
An input form is opened for users to enter a list of gene names to be marked. Gene names can be entered individually or be read from a file. By pressing the Search button, gene names are registered. Locations of the registered genes are indicated on each axis of the dotplot display, and a new table window is opened containing the information of the these genes.
Additional calls of this function will add genes to the existing list. To remove genes from the list, enter the gene names to be removed and press Clear. To clear the entire list, press All Clear.
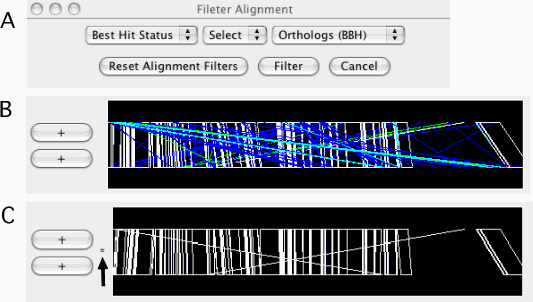
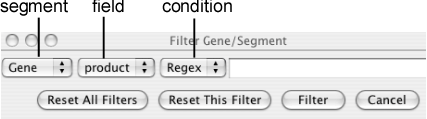
Filter Alignments
Filtering out the alignments that do not satisfy the specified conditions. Alignments are filtered from both the alignment and dotplot displays. A filter can be applied to one of the following fields:
Identity: percentage identity; numeric.
Score: similarity score; numeric.
Best Hit Status: one of the following: 3, orthologs (bidirectional best hits, BBH); 2, duplicated only in the sequence-2; 1, duplicated only in the sequence-1; 0, paralogs.
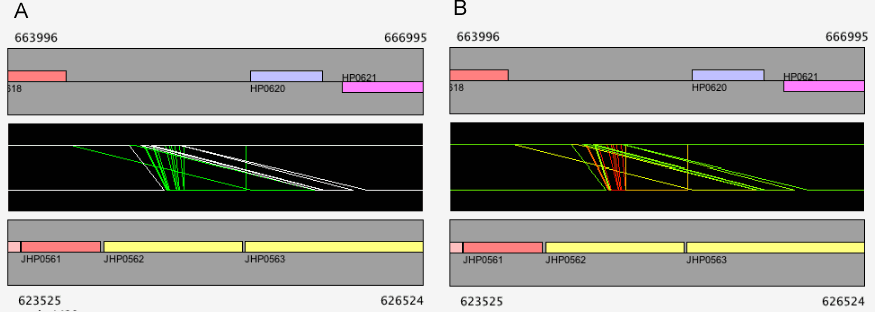
Once filtered, a '*' mark is displayed on the left side of the alignment track (see Figure 11C). Additional calls will add filters to the existing one. For example, users can specify conditions such as "Best Hit Status is BBH and Identity ≥ 90%" by two successive calls of this function. To reset the filters, press the Reset Alignment Filters button.
Filter Genes/Segments
Filtering out the genes or feature segments that do not satisfy the specified conditions. A filter can be applied to any field of any kind of segment that is currently loaded.
Kinds of conditions to be applied are different depending on the types of the fields (numeric and string). The following conditions are defined:
- Numeric field
Available conditions are: Between (a ≤ x ≤ b), Except Between(x < a or b < x), Less Than (x < a), Less Equal (x ≤ a), Equal (x = a), Greater Equal (x ≥ a), and Greater Than (x > a), where a and/or b are values to be specified. To specify Between or Except Between, two values should be separated by a comma (e.g. "80,90").
- String field
Available conditions are Regex (regular expression) and Equal (exact match).
Once filtered, a '*' mark is displayed on the left side of the annotation track. Additional calls will add filters to the existing one. To reset the filter on the specified segment, choose the segment type and press the Reset This Filter button. To reset all filters, press the Reset All Filters button.
Dynamic Search
Search each genome for specific segments or sets of segments dynamically, by calling a CGI script running on the server. Results will be displayed in the additional annotation tracks, or in the outermost pair of tracks (overwriting the existing data) if the maximum number of segment tracks have already been used.
Currently, the following programs are available:
Blast: BLAST similarity search for a nucleotide [blastn(direct) / tblastx(translation)] or a protein [tblastn] query sequence.
PatSearch: Regular expression pattern search. See the document of the Java regex library.
DirRep: Direct repeat search.
SimpleRep: Simple repeat (or short tandem repeat) search.
View menu
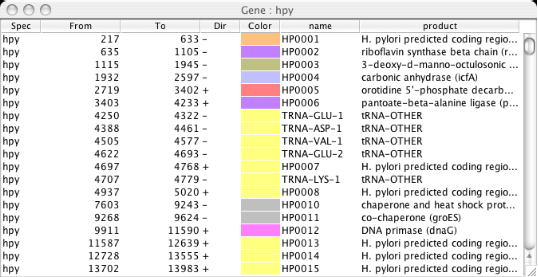
Gene/Segment Data Table
Show table of genes or specified feature segment on the specified genome. In the table, each row contains species name, the beginning position, the ending position, strand direction, assigned color, and the name of the segment. Additional fields are added, if any, depending on the segment type. By clicking a row of this table, the current scope is reset such that the specified gene or segment is centered.
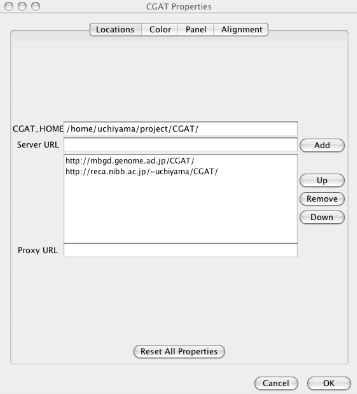
Configuring AlignmentViewer
Many properties of AlignmentViewer can be configured through property parameters. These parameters can be changed on the properties window (File ⇒ Properties). Configured properties are saved in the user home directory.
In the properties window, the properties are categorized into the following four sections.
Locations: Locations of data to be loaded. See "Load data " for loading data.
CGAT_HOME: The server home directory containing the database. You can load data from the local file system, only when the CGAT database is installed in a directory accessible from the AlignmentViewer.
Server URL: Addresses of the CGAT servers. Multiple servers can be specified. You can choose which server to use when you load the data.
Proxy URL: Specify if your organization uses a proxy server. Please ask your network administrator.
Color: Color preferences. You can set two different sets of colors for the dark and light background color modes.
Background: The background color of both the alignment track and the dotplot display.
Viewing Frame: The color of the frame indicating the current scope in the dotplot display.
Match/Mismatch/Gap: Colors for displaying nucleotide sequence alignments in the annotation track.
Identity: Colors for drawing alignment regions according to the percentage identities (the identity color mode). Colors of the three points (highest, middle, and lowest percentages) can be specified, and the others are interpolated between these colors.
Gene Attribute: Colors for drawing genes in the annotation tracks using gene attribute values. Colors of the highest and lowest values can be specified, and the remaining values are interpolated between them.
Panel: Hight of the tracks and the maximum number of tracks.
Maximum # of Segment Tracks: Maximum number of feature segments to be loaded. Possibly, the height of the tracks should also be modified (lowered) to display all the information within the screen when you want to increase the number of segment tracks.
Height of Alignment/Gene/Segment Area: Hight of the tracks in the alignment display can be set individually for the alignment track, the gene annotation tracks and the feature segment tracks.
Alignment: Alignment parameters.
Match/Mismatch/Open Gap/Extension Gap: The scoring system for dynamically calculating alignments in the AlignmentViewer program.
Size of Realignment: Maximum length of the displayed region (scope) within which the re-alignment of the sequences is allowed by right click on the alignment track.
The CGAT DataServer package
Overview of CGAT DataServer
The CGAT DataServer package is a collection of data construction scripts and CGI scripts. The data construction scripts run several programs to generate comparison data to be visualized by the AlignmentViewer program. AlignmentViewer can obtain data through the Internet using the CGI interface implemented in the server package. Alternatively, AlignmentViewer can also obtain data from the $CGAT_HOME directory when the server and client are installed on the same machine.
Data generated by CGAT DataServer can be classified into the following three classes:
- Alignment
A collection of locally aligned segment pairs between two genomes, which are displayed on both alignment and dotplot display panel in AlignmentViewer.
- Feature Segments
A collection of feature segments in each genome, which can be displayed on the feature segment tracks in AlignmentViewer.
- Gene Attribute
A value associated with each gene, which can be used to assign color to that gene in AlignmentViewer.
Directory structure
Table 1. List of directories on the $CGAT_HOME directory
| Directory | Contents |
|---|---|
| database | The current release of the database, which is accessed by the CGAT CGI scripts |
| database.work | Space for constructing the new database release |
| work | Workspace for database construction where many intermediate files are generated. |
| perllib | Perl libraries. |
| etc | Configuration tables etc. |
| build | Scripts for constructing the database |
| commands | Commands for identifying several feature segments on each genome. |
| htdocs | HTML documents and CGI scripts |
| client | Java source code of the client program (AlignmentViewer) |
Table 2. List of directories on the database directory
| Directory | Contents |
|---|---|
| genomes | Genomic sequences |
| genes | Gene information, including position table (tab subdirectory), nucleotide sequences (nt subdirectory), and amino acid sequences (aa subdirectory) |
| alignment | Collection of genome alignments calculated by several programs |
| segments | Collection of feature segments calculated by several programs |
| geneattr | Collection of gene attribute values calculated by several programs |
Database construction
Overview of the data construction procedure
Essentially, the data construction process consists of the following steps:
Prepare your genomic sequence data. If your sequences are already in the MBGD database, you can skip this step, because the procedure will automatically try to download missing data from MBGD.
Edit $CGAT_HOME/etc/speclist to specify a set of species to be analyzed and a set of programs to be executed for each species set.
Run $CGAT_HOME/build/BuildAll.pl. This script executes all procedures for building the database according to the $CGAT_HOME/etc/speclist file, and eventually constructs data on the $CGAT_HOME/database.work directory.
Run $CGAT_HOME/build/Release.pl to release the data from the $CGAT_HOME/database.work directory to the $CGAT_HOME/database directory.
Preparing genomic sequences
Before running programs, you must prepare genome sequences data. There are three possible ways.
If your sequences are already in the MBGD database, the simplest way to prepare data is to remember the abbreviated names of those genomes in the MBGD database (e.g. 'eco' for Escherichi coli K12). and use these names in the configuration table described in the next section. The build procedure automatically try to download missing data from MBGD. Note that the sequence name specified here is used throughout the system (hereafter we call it SPNAME).
Alternatively, if you have genomic data in GenBank format, you can use the $CGAT_HOME/build/getDataFromGenBank.pl script to convert it to the CGAT database. The syntax of the command is
getDataFromGenBank.pl GBK_FILE SPNAME
For example:
Here, you can use as SPNAME any name that is composed of alphanumeric characters, provided that it is unique.getDataFromGenBank.pl NC00913.gbk eco
Otherwise, you must prepare data by yourself. The data you should prepare are as follows:
Choose an appropriate unique name (SPNAME) that is composed of alphanumeric characters.
$CGAT_HOME/database/genomes/SPNAME: a genomics sequence in fasta format.
$CGAT_HOME/database/genes/aa/SPNAME: translated sequences of genes in fasta format (optional; if you want to calculate attribute values associated with protein sequences).
$CGAT_HOME/database/genes/nt/SPNAME: nucleotide sequences of genes in fasta format (optional; if you want to calculate attribute values associated with nucleotide sequences).
$CGAT_HOME/database/genes/tab/SPNAME: a tab-delimited table of genes containing the following information: beginning position, ending position, direction (1/-1), color code (= function category code; optional), the name of the gene, and the name of the product (optional). The beginning position must be smaller than the ending position even for the gene on the reverse chain. The file must begin with a header line containing a tab-delimited list of field names as follows,
By default color code is defined base on the MBGD function category. Specify '100' if you do not need to assign any color. You can change the color code by modifying $CGAT_HOME/etc/colorTab/colorTab.gene.#from to dir color name product 190 255 1 1 B0001 thr operon leader peptide 337 2799 1 1 B0002 bifunctional aspartokinase I/homeserine dehydrogenase I 2801 3733 1 1 B0003 homoserine kinase 3734 5020 1 1 B0004 threonine synthase 5234 5530 1 100 B0005 hypothetical protein
Configuring database building procedure
Next, you must prepare $CGAT_HOME/etc/speclist file, which contains information required for the database building procedure. The following information should be specified in this file:
A set of genomic sequences to be compared. If more than two species are specified, all-against-all pairwise comparison will be performed. Note that currently CGAT can handle only pairwise comparisons.
A set of programs to be executed for each sequence set.
The speclist file consists of macro definition and dataset definition sections, where macro definition must precede the dataset definition. Syntax of the definition of macro variable is as follows:
SET varname = value |
The dataset definition section is a tab-delimited table, containing the following fields: SPNAME_LIST, PROGRAM_LIST,FLAG_UPDATE, and FLAG_PUBLIC. SPNAME_LIST is a comma-delimited list specifying a set of species to be compared. PROGRAM_LIST is a space-delimited list specifying script files to be executed for each species set. The file names are relative to the $CGAT_HOME/build directory and the wildcard characters such as '*' can be used. For example, align/* specifies all (executable) files under the $CGAT_HOME/build/align directory. FLAG_UPDATE and FLAG_PUBLIC are flags specifying the data should be updated and the data should be open to the public (through the CGI script), respectively. The value should be 1 (yes) or 0 (no). Default value is 1.
The following is an example of the speclist file. The file directs the build script to compare genome sequences "hpy" and "hpj" by executing all programs for identifying feature segments in the $CGAT_HOME/build/segment directory, followed by all programs for calculating gene attribute values in the $CGAT_HOME/build/geneattr directory, followed by all programs for calculating alignment between the two genomes n the $CGAT_HOME/build/align directory.
#################### # macro definition #################### SET AlignAll = align/* SET SegmentAll = segment/* geneattr/* #################### # dataset definition #################### hpy,hpj $SegmentAll $AlignAll |
Start building
Run BuildAll.pl under the $CGAT_HOME/build directory to execute building procedures. This script creates $CGAT_HOME/work directory if not exists, and move to this directory, and then executes programs that have been specified in the $CGAT_HOME/etc/speclist file in the previous section.
BuildAll.pl |
Web server set up
AlignmentViewer can directly access the resulting data file locally when the environmental variable $CGAT_HOME is correctly set. Therefore you can skip this section if you intend to use AlignmentViewer only on the machine on which the database was constructed. On the other hand, if you want to allow access to the database from various machines through the Internet, you must set up a web server on the server machine.
If there is already a HTTP server running on the server, the simplest way to add the CGAT service to the existing server is to create a symbolic link to $CGAT_HOME/htdocs/CGAT on a web site directory. For example, if you have a public_html directory on your home directory as your own homepage, you can add CGAT service to this page by creating the above symbolic link on this directory:
ln -s $CGAT_HOME/htdocs/CGAT ~/public_html |
Next you must edit the httpd.conf file to modify the server setting. The location of the httpd.conf file is system dependent; on Mac OSX, user specific configuration can be described in a separate file, /private/etc/apache2/users/USERNAME.conf (for 10.5) or /etc/httpd/users/USERNAME.conf (for 10.4), where USERNAME should be replaced with your username. In any way, this step usually requires administrator privilege. Please ask an administrator of the machine if you do not have the privilege.
The following is a configuration required for the above example where the server is located on the public_html directory:
<Directory /PATH_TO_YOUR_HOME_DIRECTORY/public_html>
    Options ExecCGI FollowSymLinks
    AddHandler cgi-script .cgi
    SetEnv CGAT_HOME /PATH_TO_CGAT_HOME
    SetEnv PERLLIB /PATH_TO_CGAT_HOME/perllib/
</Directory>
|
Possibly, you may need to load some additional Apache modules. For example, the above setting contains the SetEnv directive which requires the mod_env module. If this module is not loaded in the default setting, you must add the following line to the httpd.conf file.
LoadModule env_module MODULE_PATH/mod_env.so |
Please remember that you must restart the HTTP server to reflect the change after you modify the httpd.conf file. Typically, this can be done by the command apachectl restart . Mac OSX users can turn on/off the HTTP server by turning on/off, respectively, the "Personal Web Sharing" service in the Sharing pane opened through Apple menu ⇒ System preference ⇒ Sharing.