The main window of AlignmentViewer
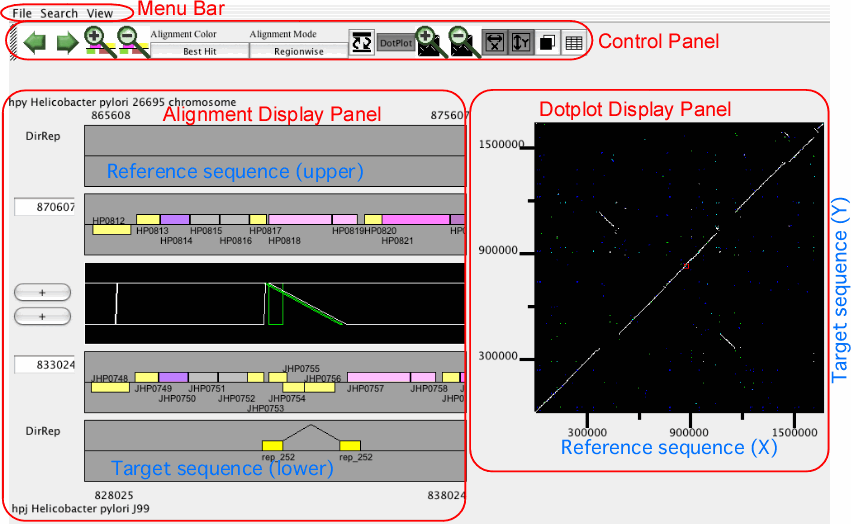
The main window of AlignmentViewer consists of four parts: a menu bar, a control panel, an alignment display panel, and a dotplot display panel. Both the alignment and dotplot displays show precomputed alignments. Users can change the current view on each display by pressing a scrolling or zooming button on the control panel. These operations update both the alignment and dotplot displays in a coherent manner.
In AlignmentViewer, one of the compared sequences is considered as the reference sequence and the other is considered as the target sequence. In the alignment display panel, the reference and the target sequences are displayed on the upper and lower tracks, respectively, and in the dotplot display panel, the reference and the target sequences correspond to the x- and y-axes, respectively. These sequences can be exchanged by View ⇒ Exchange Reference Genome.
Control panel
The control panel contains several buttons for controlling the current view of both the alignment and dotplot displays.
- Move left/right
Move the current position to the left or right along the current alignment.
- Zoom in/out
Zoom-in or -out the current view.
- Alignment color
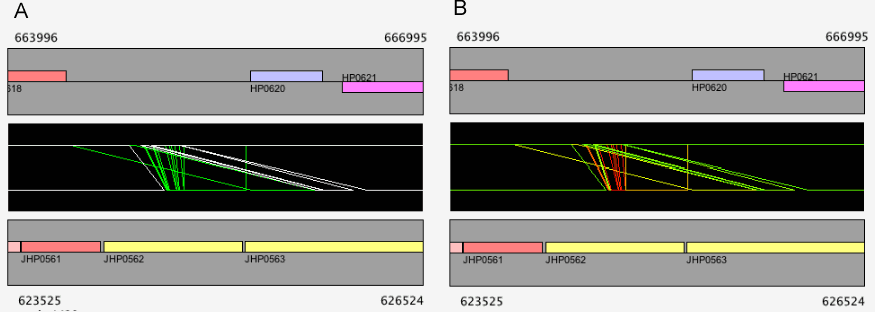
Toggle the alignment color mode between the "Best Hit" mode and the "Identity" mode.
Best Hit: white, orthologs; cyan, duplicated on the sequence 1; green, duplicated on the sequence 2; and blue, paralogs (by default).
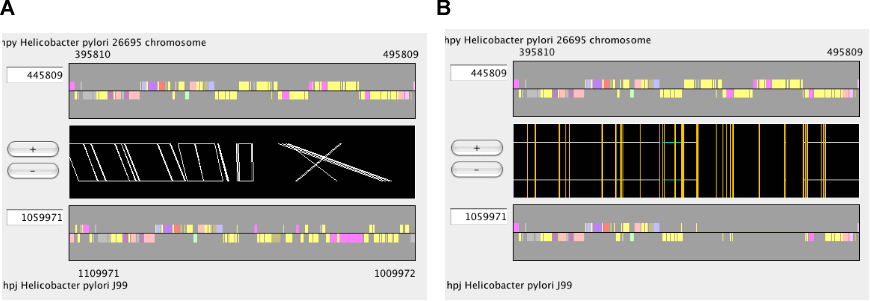
Identity: red, 50%; yellow, 85%; and green, 100% (by default).
- Alignment mode
Toggle the alignment mode between the "Regionwise" alignment mode and the "Reference-target" alignment mode. See the section " Alignment display panel ".
- Exchange ref-target
Exchange the reference sequence and the target sequence.
- Display dotplot
Toggle the status of the dotplot display panel between displayed and hidden.
- Zoom in/out dotplot
Zoom-in or -out the dotplot display.
- Zoomed axis
Specify the axis of the dotplot to be zoomed individually.
- Change background
Toggle the background color of the alignment and dotplot displays between the dark color (black by default) and the light color (white by default).
- Show annotation table
Show an annotation table for information on gene or feature segment.
Alignment display panel
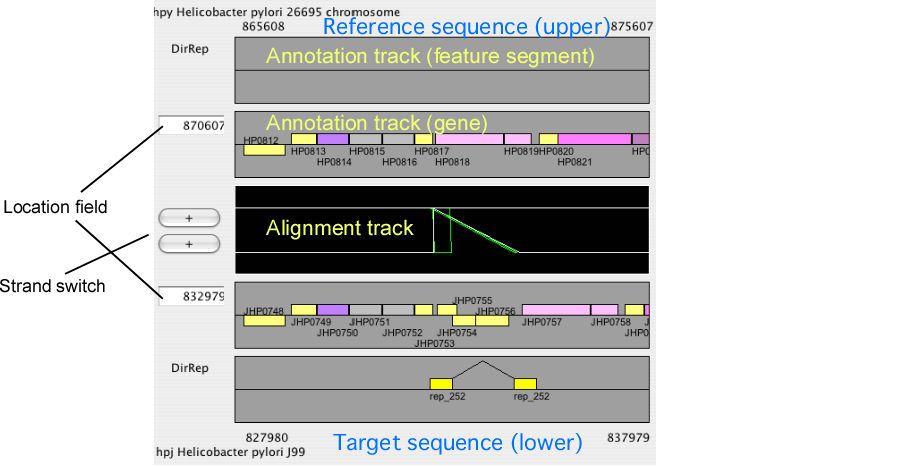
The alignment display panel contains three basic tracks: the central tracks (alignment track) shows a graphical representation of the alignments, and the upper and lower tracks (gene annotation tracks) show the gene annotation of the upper and lower genomes, respectively. More annotation tracks can be added to display the location of several feature segments.
In addition, the "location fields" and the "strand switches" are on the left side of the tracks. The location field indicates the central coordinate of the current view, and strand switch indicates the strand of each genome currently selected. Users can jump to the desired location by entering a coordinate value or a gene identifier (e.g. HP0812) in the location field, and can toggle the strand direction by pressing the strand switch.
Some notes: 1) You must always enter the location of the reference genome if you want to see the orthologous alignment around the specified locus. If you want to specify the location in the current target genome, you should exchanges the reference and the target genomes before entering the position; 2) If you invert the reference genome by the strand switch button, the direction of the subsequent movement is also inverted. This means that when you press the 'move left' button, the cursor in the dotplot display will move right, since the coordinate of the dotplot display is not changed by this operation.
Alignment modes
In CGAT, there are two modes in the alignment display: "regionwise" alignment mode and "reference-target" alignment mode. In the regionwise alignment mode, all alignments included in the current view are displayed. Each alignment is represented as a trapezoid formed by connecting the corresponding endpoints of the aligned region. On the other hand, in the reference-target alignment mode, every orthologous regions of the target sequence is mappend as a fragment onto the reference sequence.
Alignment track
The alignment track displays precomputed alignments schematically. Using the zooming buttons in the control panel, users can change the scale from the entire genome level to the single nucleotide level. In the nucleotide sequence alignment, mismatched site is colored red and gapped site is colored green (by default).
In the regionwise alignment mode, left click on one of the alignment regions (tetragons) sets the center of the selected alignment adjusted to the center of the display.
By right click on the alignment track, a pop-up menu appears including the following items:
View Re-Alignment: Re-calculate alignment between the sequences within the current displayed region. This item appears only when the current displayed region is smaller than the specified length (Size of Realignment). See the "Configuring AlignmentViewer" section.
View Alignment: Display the precomputed alignment under the clicked position.
Ident = ## %: No action. The item is displayed only for showing the percent identity of the precomputed alignment under the clicked position.
Color Legend: Display the color legend for the current alignment display.
Annotation track
The annotation track displays several types of feature segments identified in each genome.
By left click on one of the feature segments in the annotation track, a pop-up menu appears:
SegmentName: Open the web browser to access the web site, if an appropriate URL is defined on the server. Otherwise, no action is taken.
View Sequence: ## - ##: Show the nucleotide sequence of the feature segment.
Clicked Pos: ## : No action. The item is displayed only for showing the clicked position.
Redraw (Set Center=##) : Move the clicked position to the center of the display window.
Search Alignment ## - ## : Search the set of precomputed alignments for those covering the region around the clicked position.
Color Legend: Display the color legend for the current annotation display.
Dotplot display panel
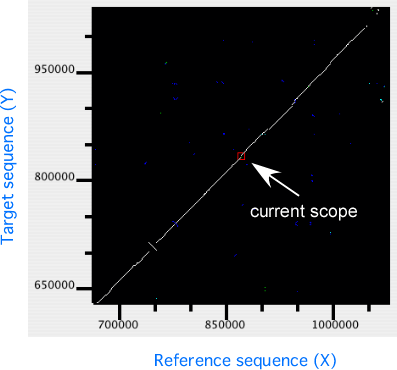
In the dotplot display panel, all alignments are plotted onto the 2-dimensional space with the horizontal (X) and the vertical (Y) axes representing the reference and the target sequences, respectively. In this plot, the current scope, i.e. the region displayed in the alignment display, is also shown as a rectangular region. Users can move the current scope by clicking on any points in the plot to move.
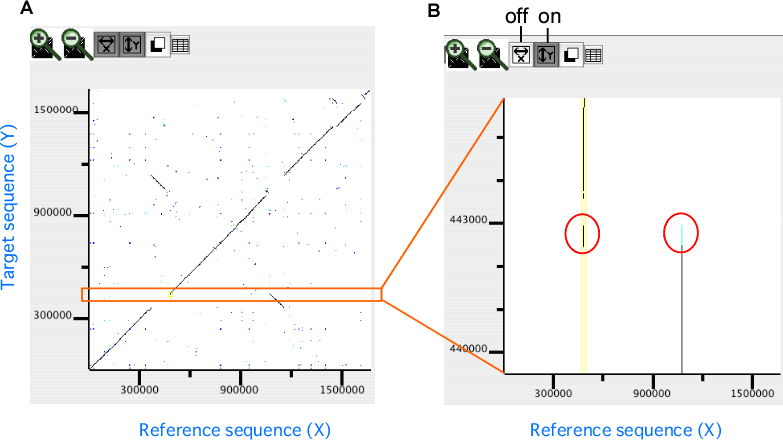
In the dotplot display, independent scaling of the x-axis and y-axis is possible. This feature is useful in visualizing the distribution of homologous regions of a specific segment on one genome against the entirety of the other genome. In the following example, dotplot with expanded y-axis scale clarifies the presence of inverted duplication at both ends of the rearranged segment on the reference genome (x-axis).
