MBGD Top > Introduction > Functions
Introduction to MBGD
MBGD Interface Flow Diagram
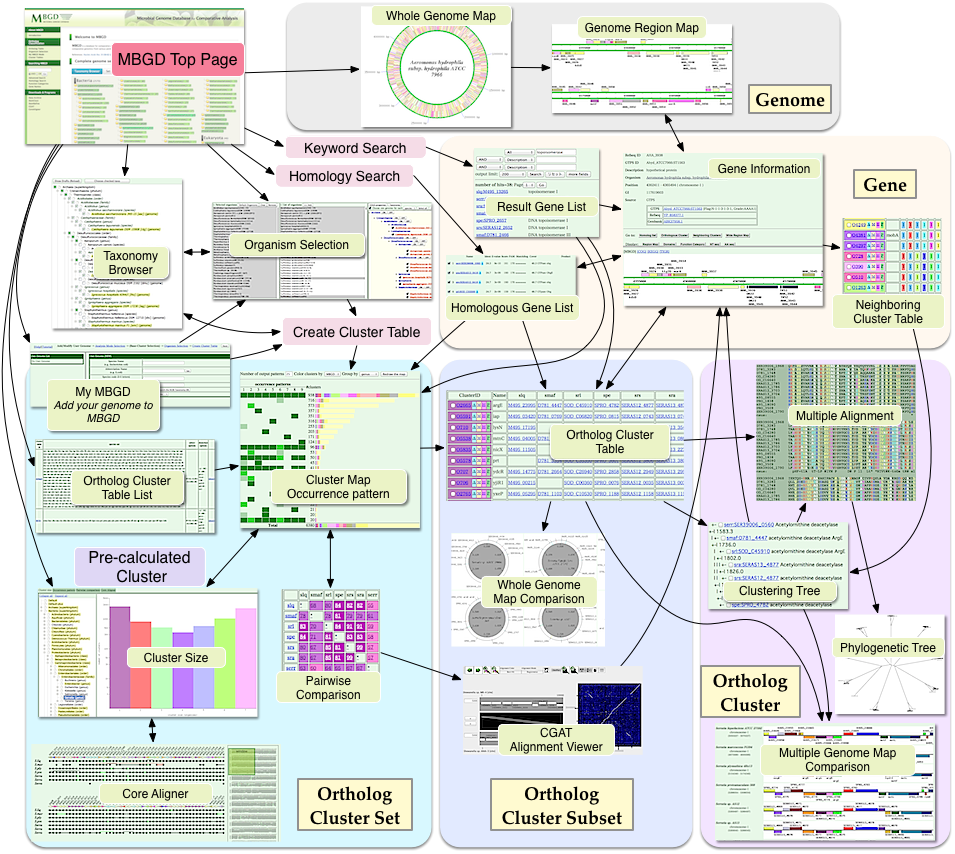
Generate/view Orthologous gene table
This is the main function of MBGD. Genes in the chosen genomes are classified by the hierarchical clustering method known as UPGMA using precomputed similarity relationships identified by all-against-all BLAST searches. The result is displayed as a histogram which we call 'Gene Cluster Map' where clusters obtained are summarized by the phylogenetic patterns (representing presence or absence of each orthologous group in each genome) and function categories. Cluster tables that you generated are stored on the server. You can list and recall them at the 'Cluster Table List' page.
Keyword search
At first the system searches the database for gene records containing the specified keywords and later it finds the homology clusters including them. MBGD uses the functions of MySQL database management system.jp See keyword search help for usage.
Homology search against MBGD
In this function, the system searches for similar sequences to your query sequence by the same way as the method used in MBGD described below. You can overlay the query sequences on the MBGD gene cluster table using the same cutoff parameters.
Organism selection
You can specify a set of organisms to be analyzed. Choice can be done on the taxonomy browser generated from the NCBI Taxonomy database. Once specified, the target orgamsims for every analysis are limited to the chosen set throughout the session.
Homology parameters
In MBGD, sequence similarities between ORFs are retained when p-values by BLAST searches are less than or equal to 10-2. For each pair, more rigorous score is calculated by dynamic programming method with PAM250 scoring matrix. Homology cutoff parameters for clustering are used throughout the whole functions in MBGD and can be changed in any time. See MBGD homology parameters for detail.