MBGD Top > Quick Tour > Create ortholog table
Create ortholog table
- In MBGD, users can create an ortholog table using any set of specified organisms. To do so, click "Organism Selection" on the top page.
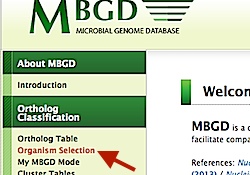
- By default, the set of "Default Organisms" (including one genome from each genus) is selected.
If you want to make your own set, push [Clear All] button. - Choose organisms from the taxonomy tree. In this example, we choose
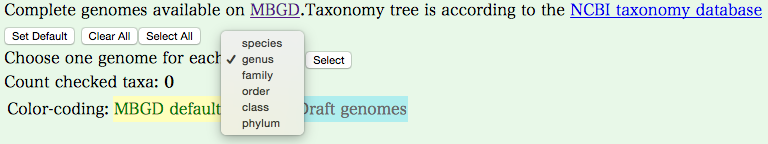
- Choose one genome for each [genus]
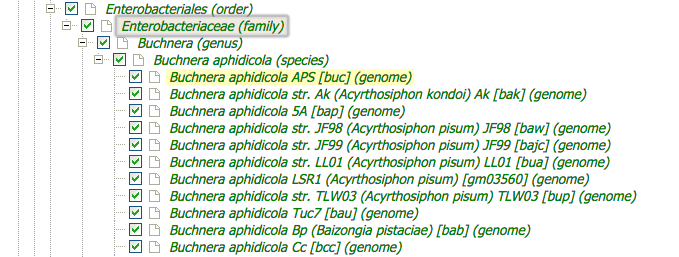
- Enterobacterioase (family)
- Select "genus" from pulldown menu.
- Check Enterobacterioase (family)
- Go back to the top of page, and press [Select] buttom.
- Press [Execute Clustering] button to start clustering. If
the cache already contains the clustering result from the same set of
organisms and parameters, the result is immediately returned.
Otherwise, a new clustering procedure is invoked.
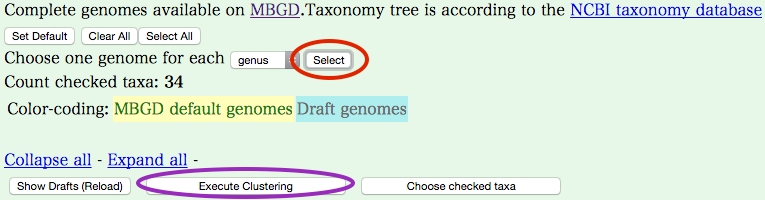
Typically a few minutes of computation time is required for clustering with 20 or less genomes (and tens of minutes may be required for more genomes).

- Click the "Occurrence pattern", then Gene cluster map is displayed.
The left side of the map shows so-called phylogenetic patterns,
which represent presence or absence of each gene in each
genome, and the bar graph on the right side shows the number of
clusters corresponding to each phylogenetic pattern. Colors of this
bar graph represent function categories.
Note that in MBGD 'cluster' means homologous or orthologous groups
created by clustering rather than a set of genes adjacent
to each other on a chromosome.
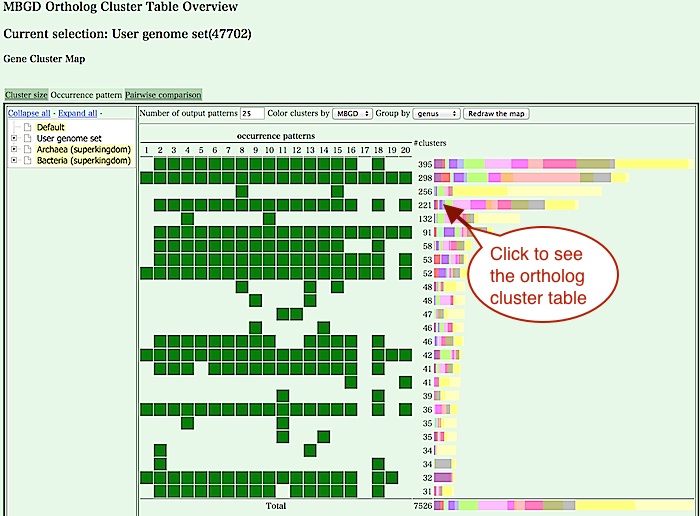
From this map, there are several choices to see or explore the cluster table.- Click the bar graph of the right side of the map to see clusters having a specific phylogenetic pattern (see below).
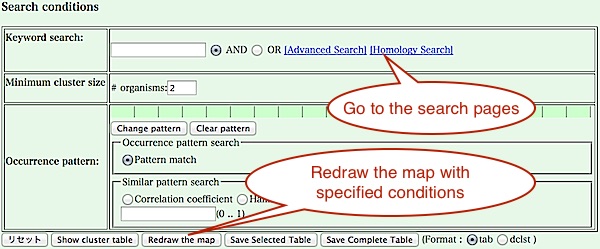
- Redraw the map with some specific conditions on phylogenetic patterns or keywords. After that, press "Show cluster table" button to see all of the clusters that match the conditions.
- Go to the page for advanced keyword search or homology search against the created cluster table. Alternatively, you can return to the top page and try any function. The cluster table just created is stored into the system and is used throughout the session unless you will change a set of organisms or parameters.
- Cluster table viewer shows a table of
orthologous (or homologous) gene clusters, usually a subset of
clusters that match some specific conditions.
The following example shows orthologous clusters absent only in Buchnera .
The first column of each row (a cluster)
is colored according to the function category. It contains
a cluster identifier (e.g. O1230) that is automatically assigned by the
clustering program, which provides a link to the detailed view of
the clustering results (Cluster viewer, see below).
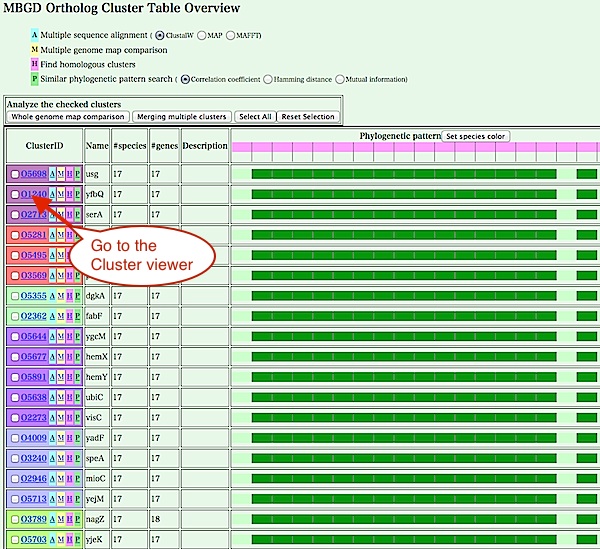
There are also three buttons that directly call the following programs: multiple sequence alignment ('A'), multiple map comparison ('M'), and finding homologous clusters ('H'). These functions can also be called from the cluster viewer page shown below.
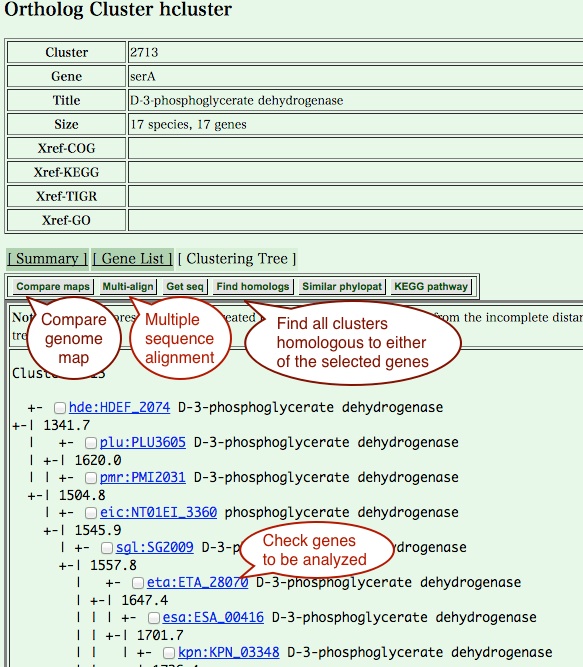
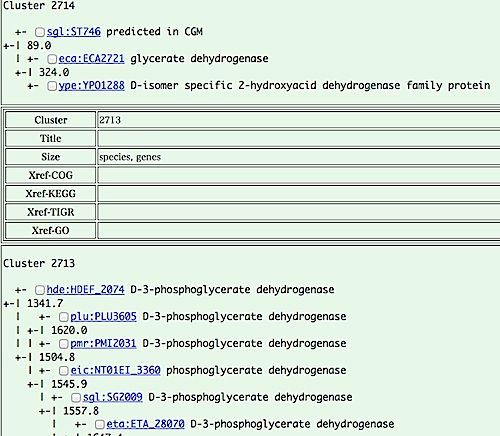
- Cluster viewer is a detailed view of an individual
clustering result, including a hierarchical clustering tree of
orthologs. From this page, you can choose genes to be analyzed,
and see a multiple sequence alignment of or a comparative genome map
around these orthologs. For more specific analysis, you can also obtain
a set of sequences to be subjected to the other programs.
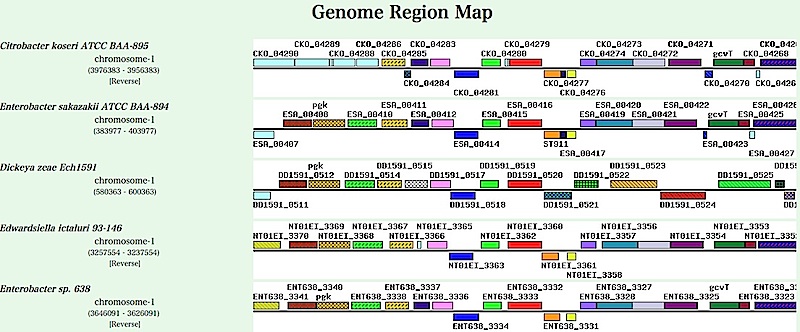
- Multiple genome map comparison page contains a comparative
display of chromosome maps around genes in a specific orthologous
group (in this case ilvE orthologs),
where all orthologous genes found in these regions
are drawn by same colors and patterns.
- By pressing "Find homologs" button in the cluster viewer page
(or 'H' button in the cluster table viewer page), you can find
all clusters that are homologous to the current clusters.
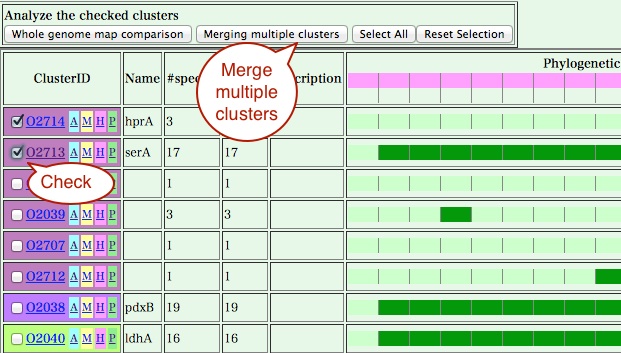
In this table, clusters are ordered according to the average similarity scores against the original cluster and genes that are actually homologous to the current cluster are highlighted in red. Here, the first cluster is the original cluster itself and the second is a newly found one. You can merge these clusters by checking the left most checkbox of each cluster and pressing the "Merging multiple clusters" button.
A cluster viewer containing the two clusters are shown. You can calculate a multiple sequence alignment or draw a comparative genome map using the genes in this merged group.
Let's move to the next tour: 5. My MBGD: Add draft genomes to your ortholog analysis in MBGD